Customer behavior
Understand patterns across customers, purchases and activity.
An analytics dashboard concept focused on customer behavior, KPIs, trends and decision-ready reporting — built to turn raw business data into a clearer picture of what customers are doing.
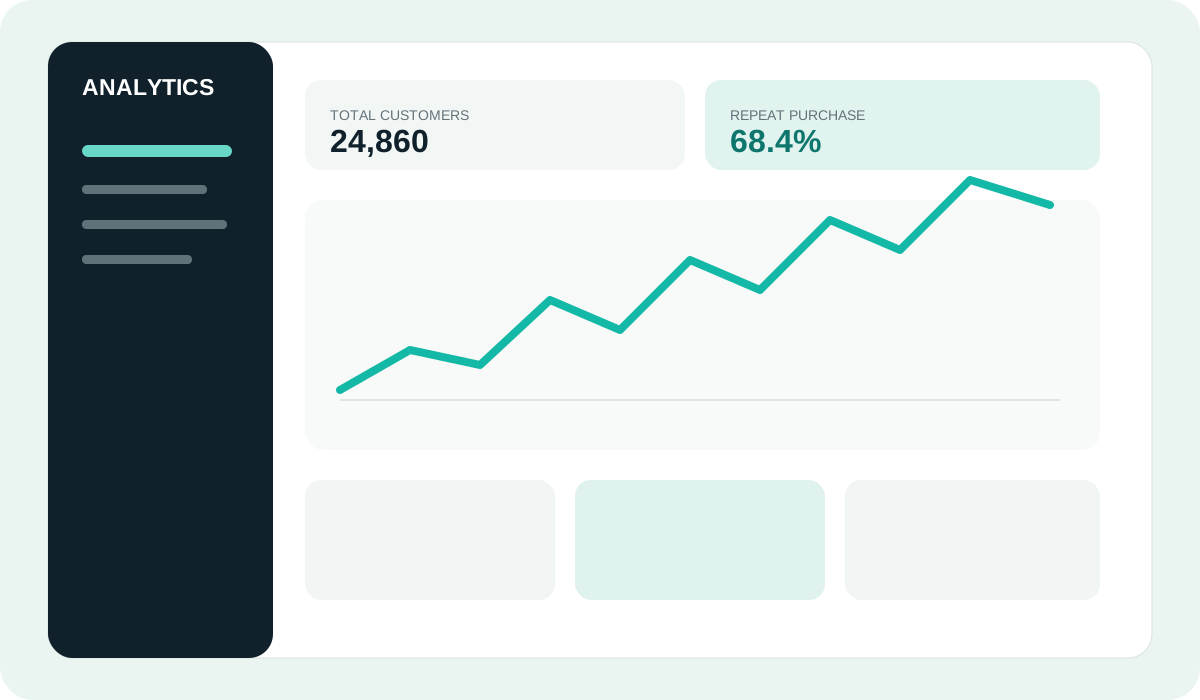
Business data can answer useful questions, but only when the right metrics are organized and presented clearly. This dashboard brings customer activity, repeat behavior and performance trends into one analytical view.
Understand patterns across customers, purchases and activity.
Keep important business metrics visible and easy to compare.
Track changes over time to identify useful patterns and shifts.
Present findings in a format that supports practical business conversations.
Organize the main information around the questions a visitor is likely to have.
Use readable hierarchy, sensible spacing and layouts that adapt to smaller screens.
Check the content flow, key links and overall usability before presenting the final experience.
We can discuss your requirements and shape the scope around your business.
Yes. The information structure and visual direction should be tailored to your audience, content and project goals.
Share your goals, current materials and any reference links through the project enquiry form. We can discuss a practical scope.
Tell us what data you have and what decisions you want it to support.